Projecting Red Wings’ point and WAR totals for 2019-20 season (version 2.0)

By Tom Mitsos
4 years agoHockey has started, but the @Detroit Red Wings will have to wait until Saturday to begin their 2019-20 season.

Until then, we can attempt to predict how many points the Red Wings will get. This season is a rebuilding year, there’s no doubt about that, but can the team improve under new general manager Steve Yzerman?
As you may remember, I used Sean Tierney‘s WAR Lineup Creator back in July to attempt to determine where Detroit would fare in the standings. Unsurprisingly, the roster hasn’t changed a whole lot since I did the exercise two months ago.
However, the moves that were made appeared to slightly improve the Red Wings’ odds of finishing with more points.
If you’re having trouble reading the chart, open it in a new tab.
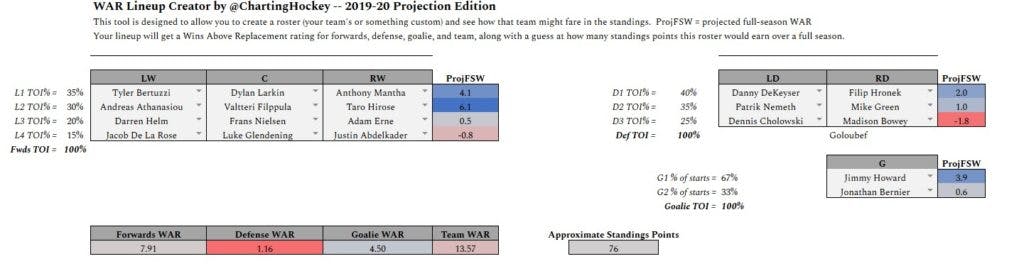
Point and WAR totals for 2019-20 season. (Chart via Sean Tierney)
According to the chart, which includes Evolving Wild‘s WAR data and Manny Elk‘s prospect data, the Red Wings will finish with 76 points, two points more than they finished with last season. My original chart in July had them pegged at 69 points.
It’s not an unreasonable prediction. The team still is very veteran-heavy that features a lot of depth players and not much skill, but with growth from the big four of @Dylan Larkin, @Anthony Mantha, @Tyler Bertuzzi and @Andreas Athanasiou, we should see some minor improvement.
The biggest change from July to now is on the third line with @Adam Erne replacing @Filip Zadina, and @Frans Nielsen replacing @Valtteri Filppula. That’s not to say that Erne’s presence alone adds seven points to the overall standings.
What is most likely to blame for the large WAR swing is the fact there isn’t a lot of data on Zadina. He played in just nine games last season, scoring a goal and adding two assists. A WAR model is not going to reward a player who only has nine games worth of data since it isn’t a large enough sample size to draw any conclusions, whereas Erne has played 114 NHL games since 2016-17.
At 24 years old, Erne still has a chance to better himself as a player, but we have a general idea of what kind of player he is and can more accurately calculate that than we can with Zadina.
Zadina will be the more valuable player in the long run, but until he plays more NHL games, his WAR stats won’t look great.
There are a couple of other things to consider in regards to Tierney’s chart.
First of all, this prediction assumes the lines will remain the same throughout the entire season. Of course, we know that will not hold up. Not only will injuries force players in and out of the lineup, but coach Jeff Blashill is a notorious lineup shaker, so we could see new lines as early as Sunday for the home-opener.
Secondly, I’ve attempted to weigh the TOI for each line, defensive pairing and goalie as closely as I think Blashill will utilize them. However, it’s tough when someone like Luke Glendening, who was taking reps on the second line in practice just two days ago, most likely will receive more than 15% of the ice time.
The TOI weights have a dramatic effect on the WAR and, therefore, the standings. For instance, bumping the top line of Bertuzzi, Larkin and Mantha up to 85% projects the Red Wings at 77 points. Of course, no line is going to get 85% of the ice time, but it shows how valuable those three are from a generating wins standpoint. Those three should be getting the most ice time, but there’s a very real possibility it doesn’t shake out that way.
Seventy-six points might be a bit high for this team; I’m thinking it’s going to be closer to 74 or 73 and possibly as low as 70. We could see a lot of new faces this season with five first-round picks currently playing in Grand Rapids. And while young prospects are fun to watch, they’ll all have growing pains as they acclimate to playing in the NHL, which means another losing season for the Red Wings.
Recent articles from Tom Mitsos