By the numbers: 5 statistics that tell the story of the Red Wings’ season
By Tom Mitsos
4 years agoWe knew the Detroit Red Wings were going to be bad.

But I think it’s safe to say no one expected them to be this bad.
After 30 games, the Red Wings find themselves dead last in the standings, five points behind the New Jersey Devils — who have four games in hand — coming into Tuesday night’s games.
A top-four pick is looking more likely by the day, and the Red Wings are in dire need of a franchise player who can help bring them back to the glory days of the late 1990s and early 2000s.
But until then, the fanbase will have to endure 52 more games of less-than-ideal hockey.
I had planned to write this article after the 25-game mark when we have a big enough sample size for more dependable Corsi and expected goals numbers.
But game No. 25 came right around the Thanksgiving holiday, and I was too busy mentally preparing myself for overindulgence, so you’ll have to cut me some slack on the lateness.
With that being said, here are five of the most significant stats that tell the story of the Red Wings’ historically bad 2019-20 season.
-56
If you’ve been following the team at all this season, you probably already have figured out this stat. It is, indeed, the Red Wings’ goal differential after 30 games.
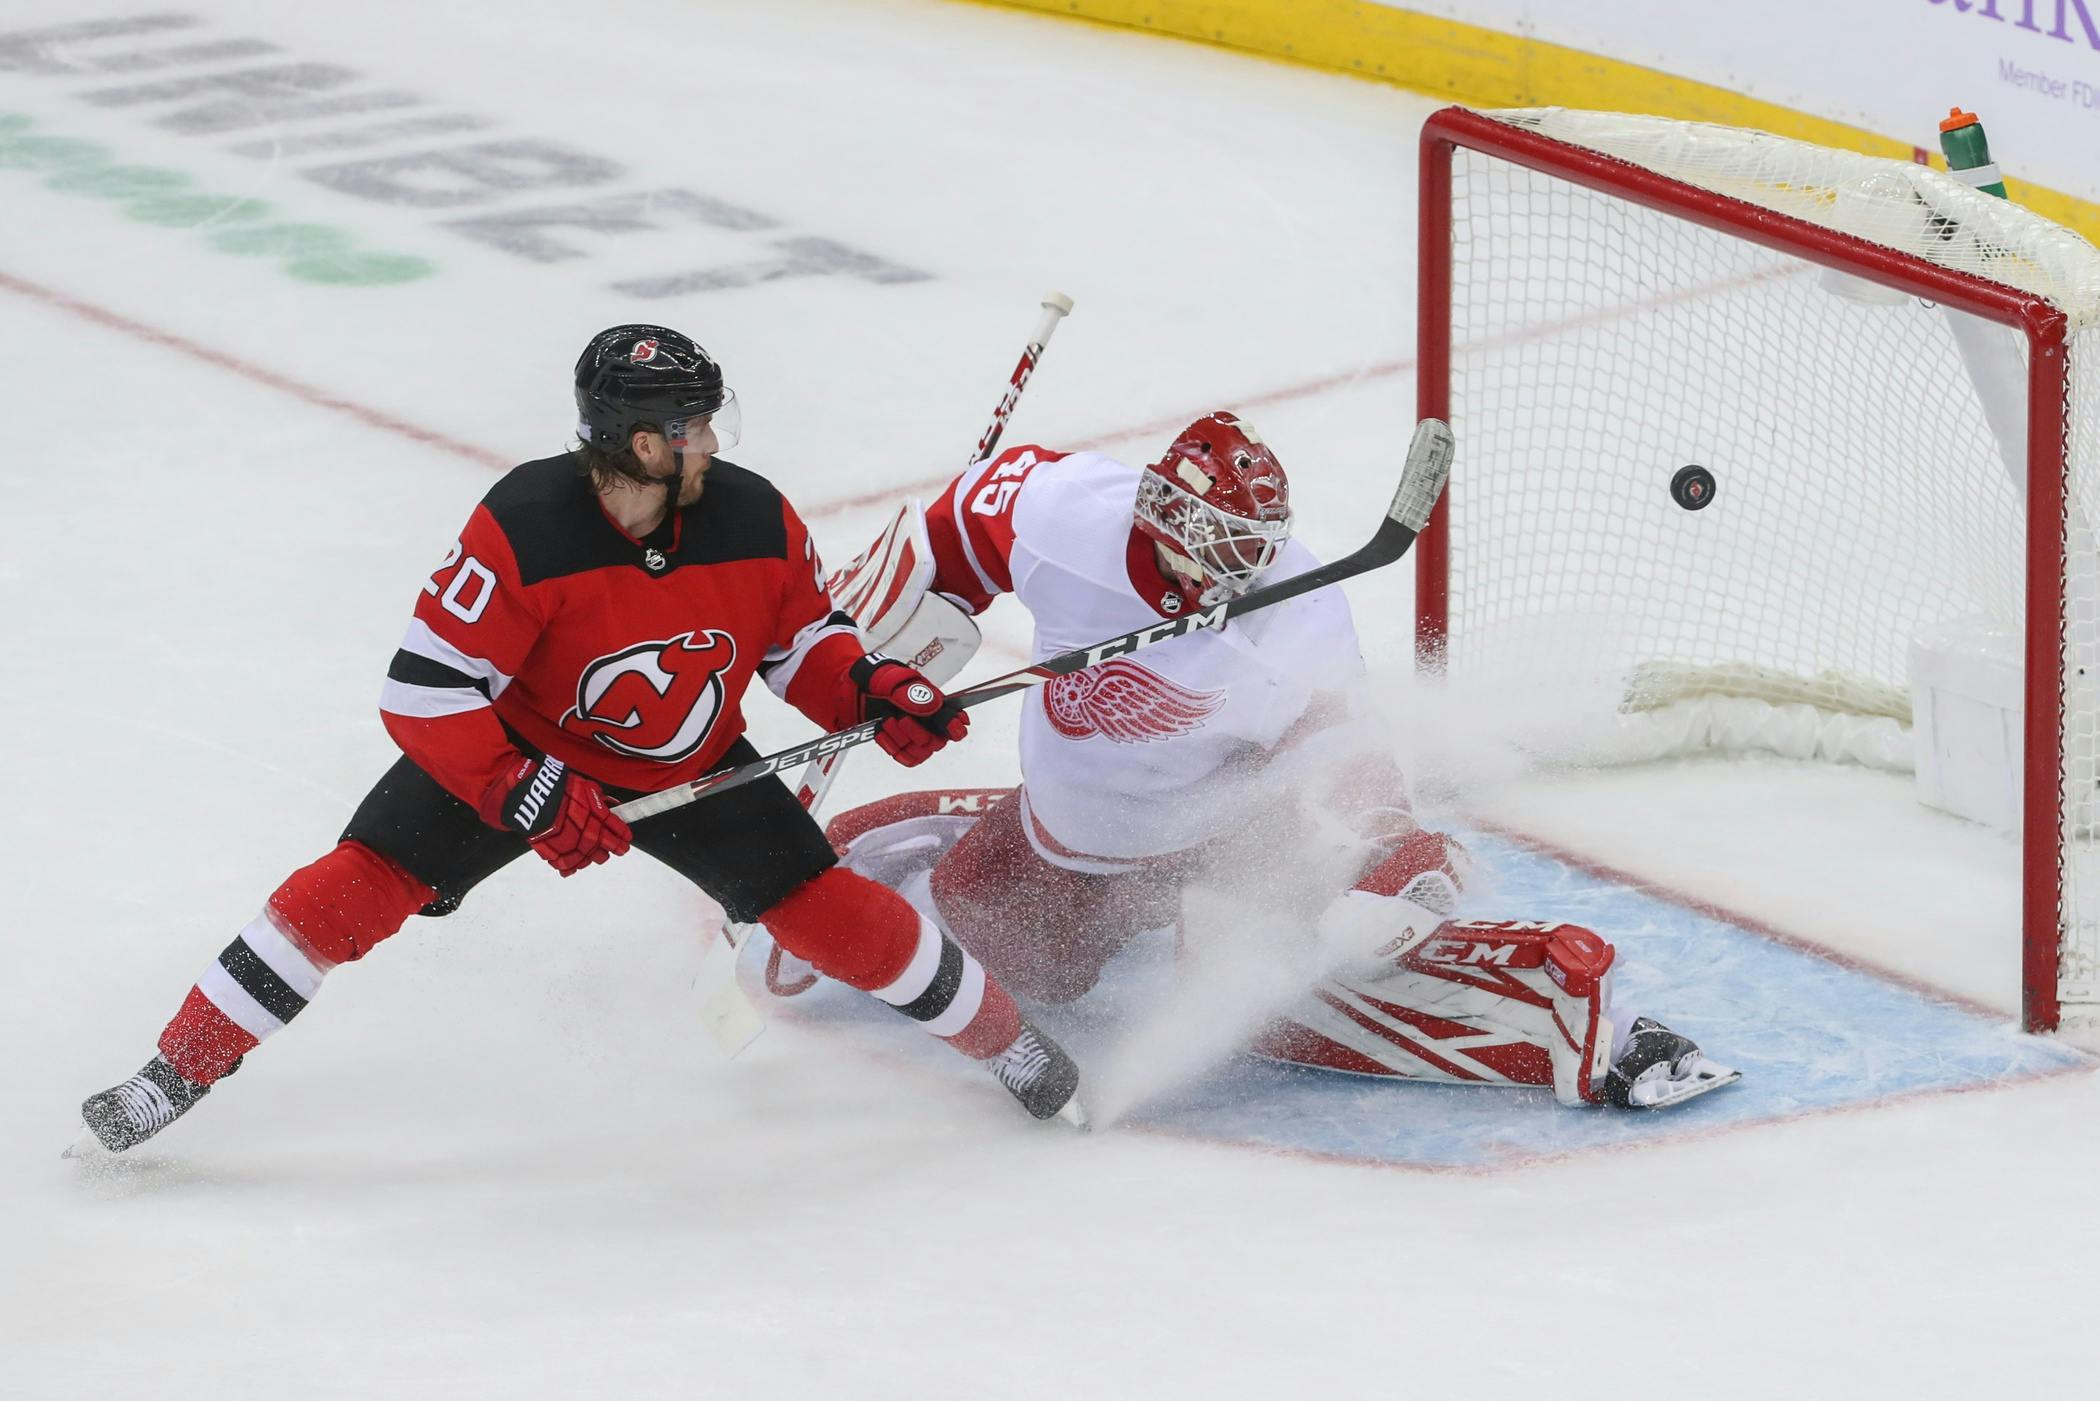
The next-closest team is the New Jersey Devils, who have a goal differential of -31. The Red Wings are the only team to have allowed more than 100 goals with New Jersey nearly there at 97.
Even though the Red Wings haven’t been a playoff team in the past four seasons, they generally got bailed out by their goaltending to keep games close and even steal a game or two.
But it isn’t just bad goaltending that has contributed to a woeful goal differential. Scoring just 2.1 goals per game, the lowest mark of the past five seasons, certainly doesn’t help the cause.
44.88%
This is the Red Wings’ 5 on 5 score-adjusted expected goals for, which is exponentially higher than their actual goals for percentage of 34.49%. The fact their expected goals for is significantly higher than their actual goals for could be due to a number of reasons.
Firstly, they have been quite unlucky. A puck redirected off a stick, a bad-angle shot finds its way in, we’ve seen these happen to the Red Wings on several occasions. But every team experiences unluckiness, so it isn’t fair to just throw up our hands and proclaim the Hockey Gods have cursed the Red Wings with bad luck.
Expected goals takes many things into considerating, including shot angle, shot location, whether the shot came from a rebound or on the rush and shooter talent.
Remember the bad goaltending I alluded to earlier? Jimmy Howard (-6.08 goals saved above average at 5 on 5) and Jonathan Bernier (-4.68) are both bottom 10 of all goalies who have played at least 300 minutes. No other team has two goalies in the bottom 10.
| 5 on 5 score-adjusted | GF | GA |
| Actual | 39.88 | 75.74 |
| Expected | 47.2 | 57.97 |
As the chart shows, the Red Wings should be scoring about seven more goals than they have, and they should have allowed 18 fewer goals than they have. A combination of should be scoring more and should be allowing less explains the piling losses.
In addition, the Red Wings have a .900 save percentage at 5 on 5, good for 28th in the league.
72.6%
This is the Red Wings’ penalty-kill percentage, another stat they rank dead last in. They’ve allowed 26 power-play goals in 95 short-handed opportunities, the most allowed in the league.
Their 78 high-danger shot attempts also rank last in the league. For comparison’s sake, the Columbus Blue Jackets are first in the league with 27 high-danger shot attempts allowed.
Simply put, they aren’t good at preventing high-quality chances on the penalty kill, as Micah Blake McCurdy’s graph shows. And as one of the most penalized teams in the league, it’s hard to win when you’re constantly short-handed and allowing power-play goals.
57.52%
However, it’s not all doom and gloom for the Red Wings. While they are well on their way to finishing with the worst record in the league, there are some bright spots.
This is Anthony Mantha‘s 5 on 5 score-adjusted expected goals for, which is good for 23rd in the league — better than Auston Matthews, Matt Duchene and Nikita Kucherov — among forwards who have played at least 200 minutes. That puts him squarely in first-line player territory, which has been the expectation for him since he was drafted 20th overall in 2013.
Mantha leads the team in goals (12) and is second behind Tyler Bertuzzi in points (23). He has missed the past five games due to a lower-body injury, and the Red Wings have scored just four times in those five games.
Mantha has been a streaky player in the past, but this season, he seems to have found some consistency, going no more than two games without at least registering one point.
The 25-year-old will be a big part of the Red Wings’ future, and to see him flourish despite the team’s overall lack of success is a welcoming sign.
24
This is the number of points Bertuzzi has in 30 games, which puts him well on the way to breaking his career high of 47 he set last season.
When the Red Wings drafted Bertuzzi in the second round six years ago, it left a lot of people scratching their heads and wondering if it was more about name recognition than player talent. But he’s been one of the team’s most consistent scorers this season.
Obviously, being on a line with Dylan Larkin and Mantha has helped the cause, but it’s not as if he’s being dragged kicking and screaming while Larkin and Mantha do all the work. Bertuzzi leads the team with 14 assists, eight of which are primary assists, and he’s got 10 goals on top of that, eight of which have come at 5 on 5.
Verdict
The underlying numbers suggest the Red Wings shouldn’t be this bad, but it’s also clear there are a lot of flaws. No one could have guessed Howard and Bernier would be regressing this much. And certainly, not having Danny DeKeyser for the past 22 games doesn’t help on the defensive end.
DeKeyer’s absence means AHL players like Dylan McIlrath and Joe Hicketts have been playing significant minutes, and Dennis Cholowski has had to take on a bigger role in just his second pro season.
But on the flip side, Filip Hronek, who also is in his second professional season, is flourishing and is easily Detroit’s best defenseman right now.
So, yes, this truly is a bad team, and it’s probably not going to get much better as the season progresses. But finding bright spots is what fans have to focus on now. Otherwise, it’ll be a long five months until the end of the season.
All stats courtesy NHL.com and Natural Stat Trick as of Tuesday morning.
Recent articles from Tom Mitsos

