Analyzing Red Wings’ 2016-17 expected goals

By Tom Mitsos
6 years agoThe Detroit Red Wings had a forgettable 2016-17 season. They missed the playoffs for the first time in 26 seasons and recorded their lowest point total (79) since the 1990-91 season (76), the first season that started the 25-year playoff streak.

The team had a plethora of problems, one of which was its inability to score. The Red Wings averaged just 2.4 goals per game, which was 26th overall, and 1.8 goals per game at five on five.
So was it bad luck, or did the Red Wings fail to create scoring chances? Let’s take a look at the Red Wings’ expected goals metric.
For those who don’t know, Dawson Sprigings (@DTMAboutHeart) developed an expected goals model (xG) that is a better predictor of future scoring than Corsi or goals.
Sprigings’ model takes shooter talent, shot distance, angle and type into account when determining the likelihood of whether a shot results in a goal.
Sprigings’s data, which can be found here, shows the Red Wings were 27th in the league in five on five xG percentage at 47.2. Anything below 50 percent means you are allowing more goals than scoring. Sprigings’ model had the Red Wings scoring 136 goals at five on five as of April 7 (they had 138) and allowing 152 goals (they allowed 167). So, it appears Detroit allowed a few more goals than it probably should have.
Overall, this is an accurate representation of the Red Wings’ season. But how did the players do on an individual basis? Here’s that data, which sorts all players who played at least 200 five on five minutes last season by individual xG:
| Player | TOI | ixG | ixG60 | iG | iG60 |
|---|---|---|---|---|---|
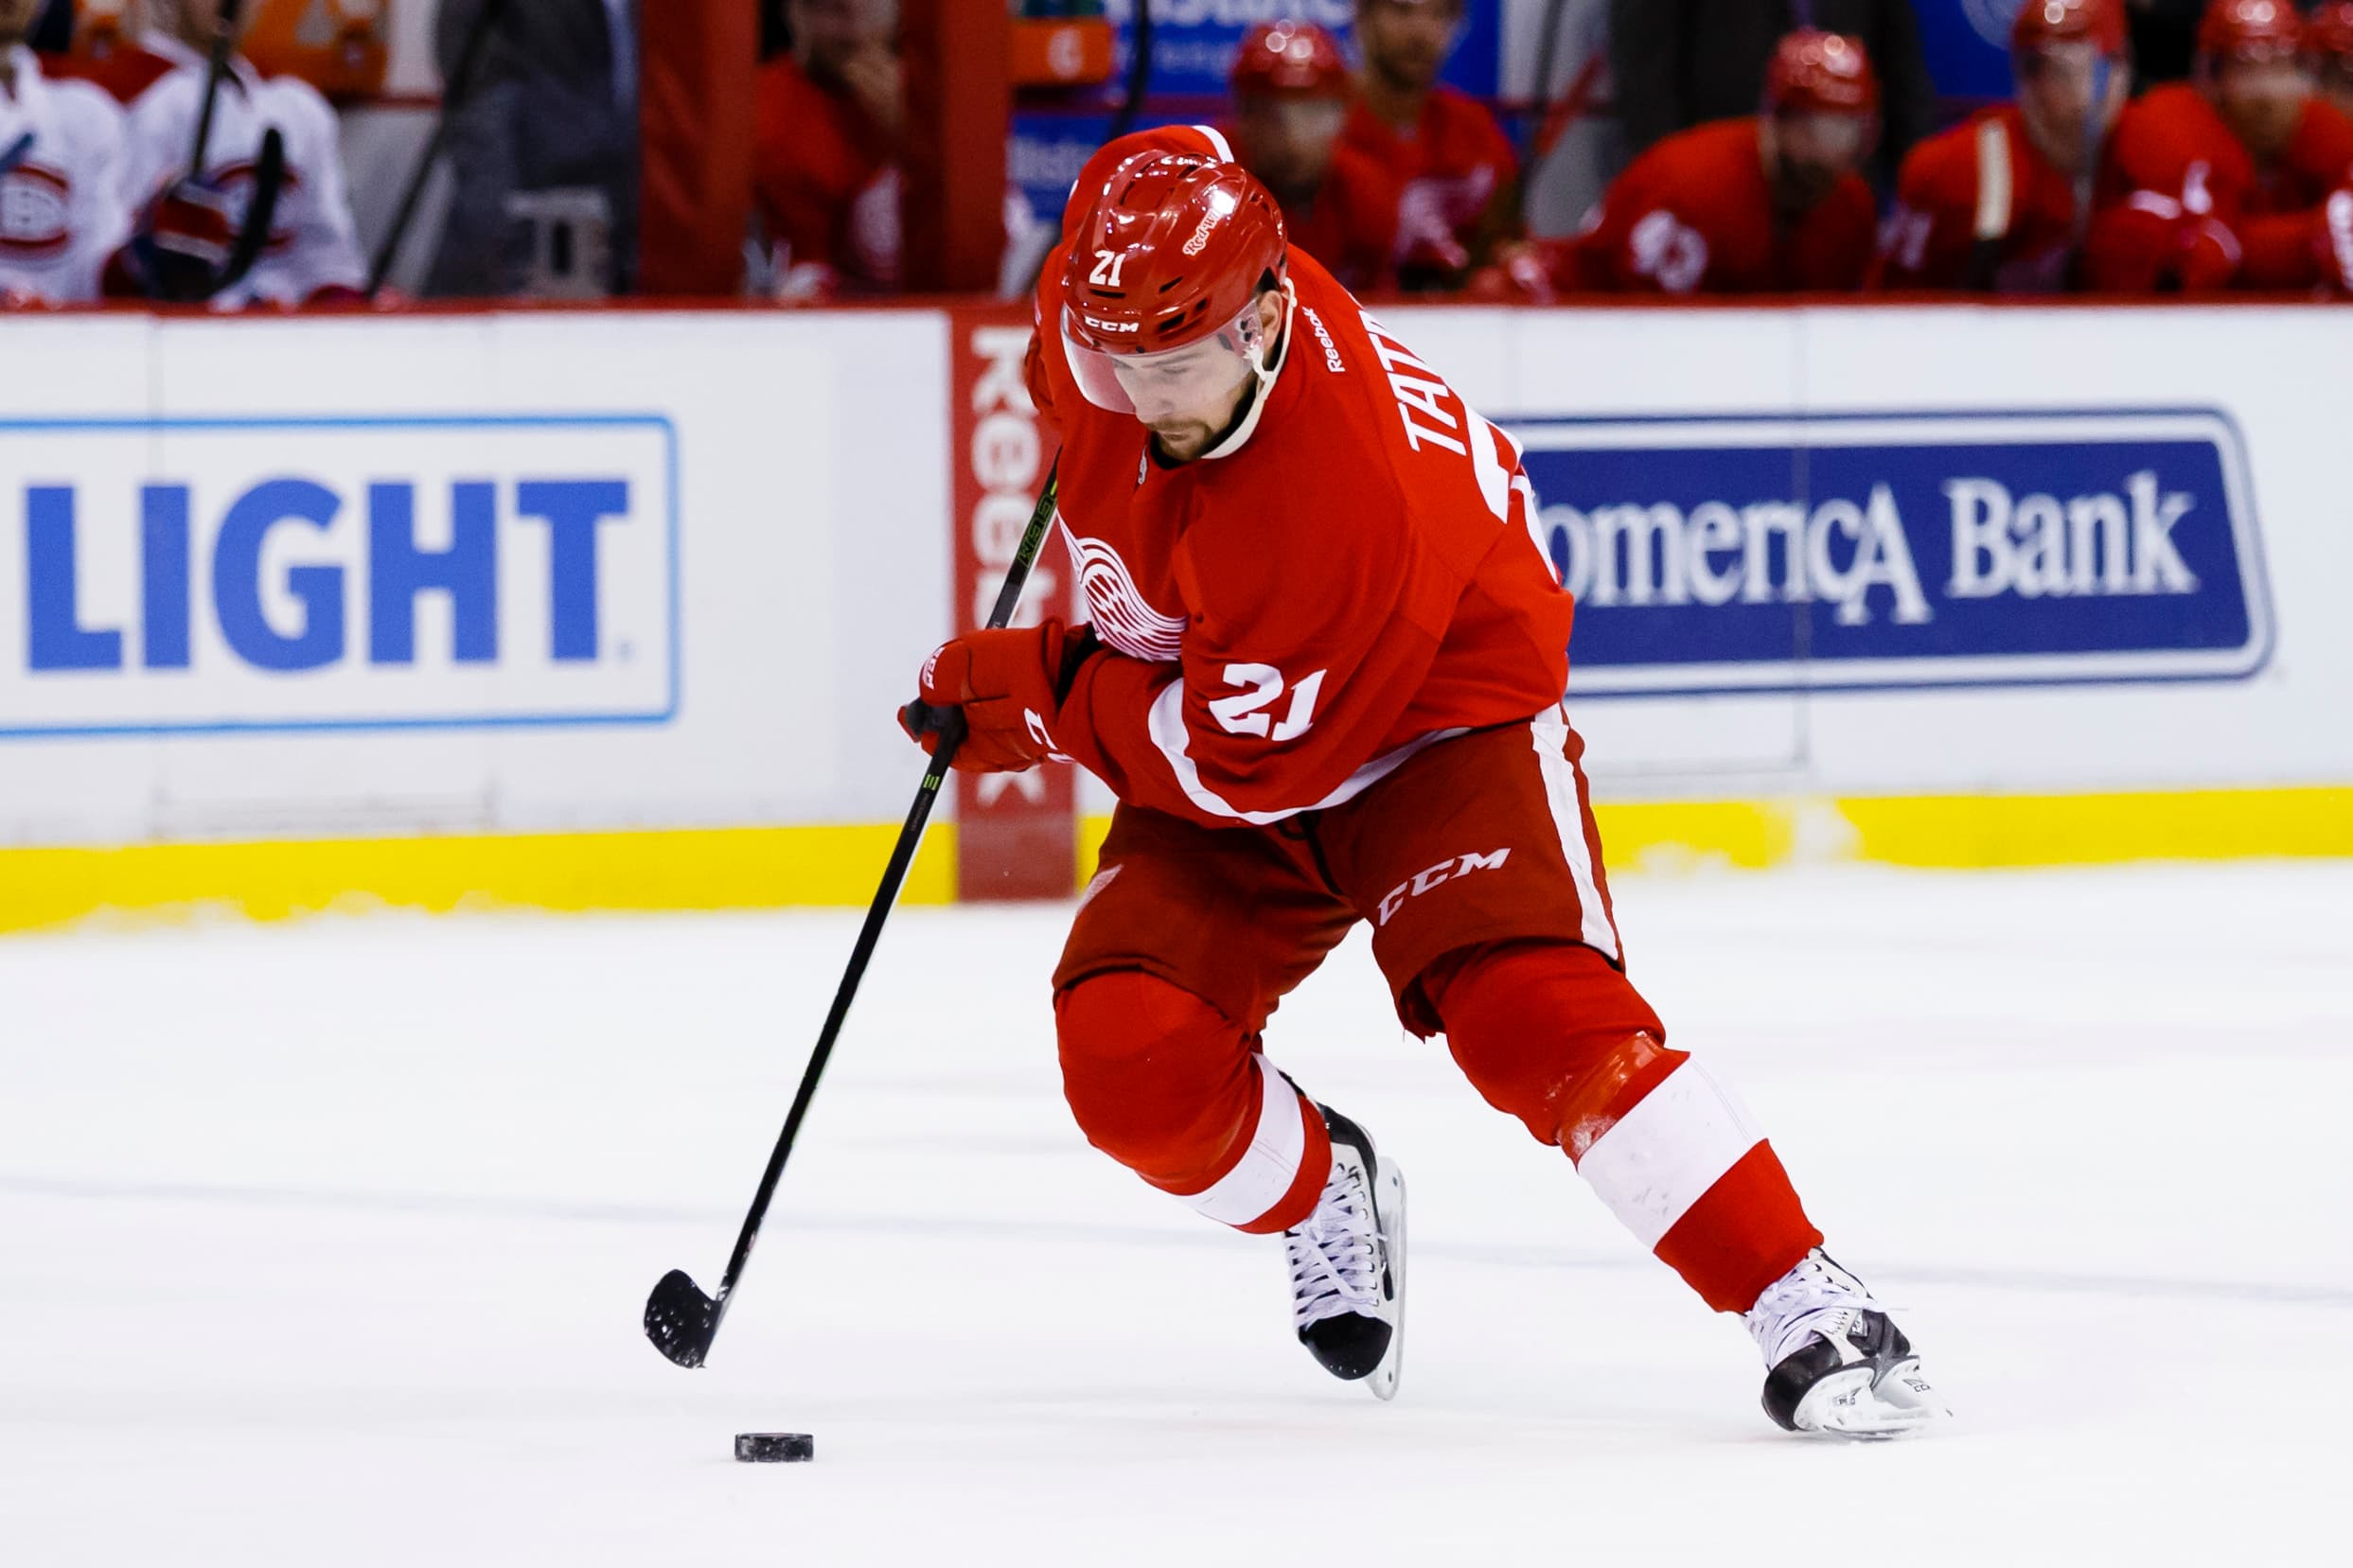
| Tomas Tatar | 1,145 | 15.69 | 0.822 | 14 | 0.734 |
| Gustav Nyquist | 1,043 | 10.58 | 0.609 | 9 | 0.518 |
| Anthony Mantha | 811 | 9.61 | 0.711 | 15 | 1.11 |
| Andreas Athanasiou | 730 | 9.32 | 0.766 | 17 | 1.397 |
| Frans Nielsen | 958 | 8.95 | 0.561 | 10 | 0.626 |
| Dylan Larkin | 1,051 | 8.84 | 0.505 | 8 | 0.457 |
| Henrik Zetterberg | 1,277 | 8.6 | 0.404 | 14 | 0.658 |
| Riley Sheahan | 901 | 8.07 | 0.537 | 0 | 0 |
| Thomas Vanek | 546 | 7.51 | 0.825 | 9 | 0.989 |
| Luke Glendening | 755 | 7.12 | 0.566 | 2 | 0.159 |
| Justin Abdelkader | 778 | 5.93 | 0.457 | 2 | 0.154 |
| Darren Helm | 593 | 5.81 | 0.588 | 6 | 0.607 |
| Mike Green | 1364 | 4.72 | 0.208 | 9 | 0.396 |
| Drew Miller | 456 | 3.52 | 0.463 | 5 | 0.658 |
| Danny DeKeyser | 1,445 | 2.77 | 0.115 | 4 | 0.166 |
| Xavier Ouellet | 1,003 | 2.72 | 0.163 | 3 | 0.179 |
| Niklas Kronwall | 844 | 2.49 | 0.177 | 2 | 0.142 |
| Steve Ott | 343 | 1.92 | 0.336 | 2 | 0.35 |
| Nick Jensen | 742 | 1.88 | 0.152 | 4 | 0.323 |
| Jonathan Ericsson | 849 | 1.78 | 0.126 | 1 | 0.071 |
| Ryan Sproul | 343 | 1.26 | 0.22 | 0 | 0 |
| Alexey Marchenko | 455 | 1.24 | 0.164 | 0 | 0 |
| Brendan Smith | 492 | 1.1 | 0.134 | 1 | 0.122 |
| Robbie Russo | 245 | 0.35 | 0.086 | 0 | 0 |
Tomas Tatar, who had 14 five-on-five goals when the data was last updated, had an ixG of 15.69, which almost is five expected goals better than second-place Gustav Nyquist (10.58). Anthony Mantha (15 goals) and Andreas Athanasiou (17) both outperformed their expected goal rates — 9.61 and 9.32, respectively, although Sprigings’ model tends to have trouble with young players/rookies since shooter talent is an unknown. Even Riley Sheahan, who hadn’t scored any goals since the data was last updated, had an xG of 8.07, which demonstrates what an unlucky season the 25-year-old had.
Outliers are expected when using a model like this. Hockey contains a lot of randomness, and while the model does closely predict many of the players, there are going to be some who overachieve and those who underachieve.
Now, with Micah Black McCurdy’s shot rates heat map, we can get an idea of where the Red Wings were shooting the puck last season.
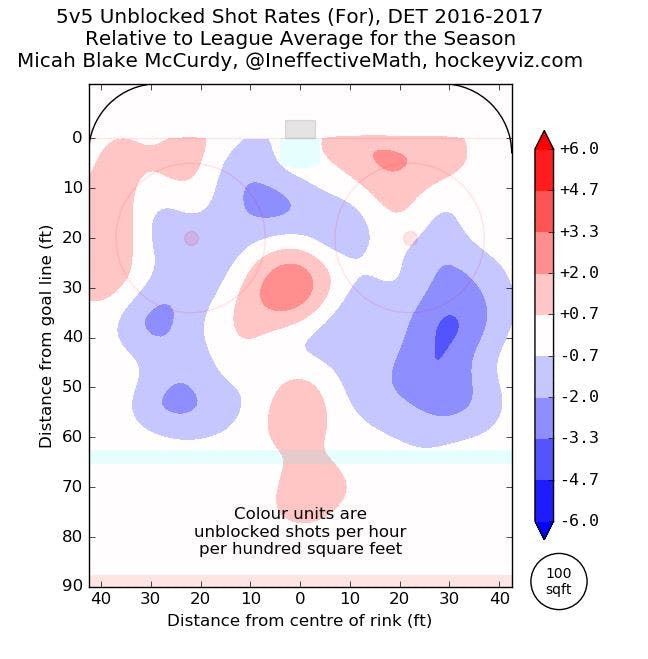
Detroit Red Wings 2016-17 shots for rate. (HockeyViz.com)
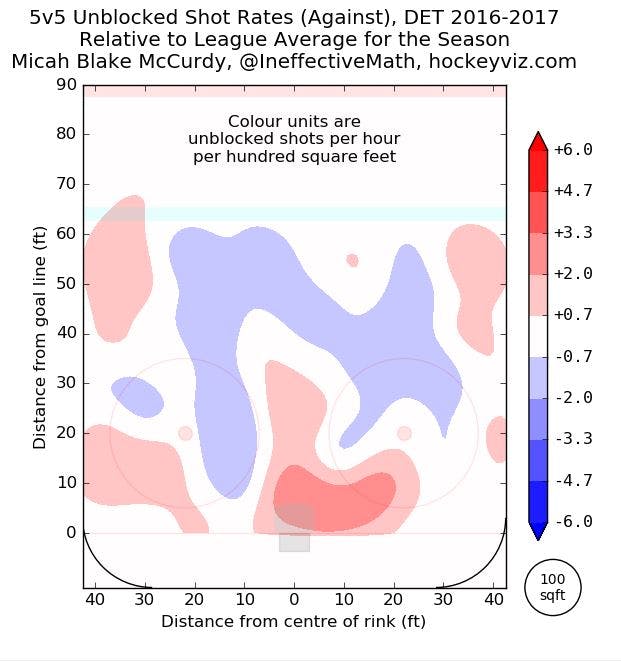
Detroit Red Wings 2016-17 shots against rate. (HockeyViz.com)
As you can see, the dark blue spot in the slot means the Red Wings had fewer shots for in that area relative to the league average, and on the defensive side, the dark red in front of the net means the Red Wings allowed more shots relative to the league average.
However, from Mantha’s team shot rate chart, we see the team had a lot of success generating offense from the slot and near the goal line when Mantha was on the ice. With Athanasiou on the ice, the team had more success near the faceoff circles.
As a whole, the Red Wings weren’t able to get into the high-scoring areas to create quality chances, but they did have a lot of success generating shots farther away in the high slot relative to the league average.
What will be interesting to watch next season is if the expected goal numbers for Athanasiou and Mantha match their actual goal numbers. Larkin knows all too well how adjustments need to be made once you complete your first season in the NHL. Athanasiou and Mantha will need to adjust to ensure they continue to generate scoring chances at five on five.
*All stats via Puckalytics unless otherwise noted.
Play Fantasy Golf with Draft Kings
Fantasy Golf Millionaire Contest:
– First place wins $1,000,000
– Over $3,000,000 in total prizes
– More than 25,000 entries win money guaranteed
– Only $33 to enter
– Simply select a team of 6 golfers to play
– Must enter by first tee time on Thursday morning

Recent articles from Tom Mitsos